Characterisation of Fractured Basement Reservoirs, Cuu Long basin, Vietnam, using 3D Structural Modelling and Discrete Fracture Networks
By
C. Sanders,1 T. A. Murray,1 and E. Thompson1
Search and Discovery Article #40027 (2001)
1Midland Valley Exploration Ltd (www.mve.com), 14 Park Circus, Glasgow, UK.
*Adapted for online presentation from poster session presented at AAPG Annual Meeting, Denver, CO, June, 2001.
Editorial Note: This article, which is highly graphic (or visual) in design, is presented as: (1) four posters, with (a) each represented in JPEG by a small, low-resolution image map of the original; each illustration or section of text on each poster is accessible for viewing at screen scale (higher resolution) by locating the cursor over the part of interest before clicking; and (b) each represented by a PDF image, which contains the usual enlargement capabilities; and (2) searchable HTML text with figure captions linked to corresponding illustrations with descriptions.
Users without high-speed internet access to this article may experience significant delay in downloading some of these illustrations due to their sizes.
First Poster
Second Poster
Third Poster
Fourth Poster
The unconventional fractured granite basement reservoirs of the Cuu Long basin in offshore Southern Vietnam have proven to be very successful structural oil plays. Workflows are presented here to characterise fracture systems in crystalline basement for exploration and production purposes of the petroleum industry. The workflows are a result of several case studies in the Cuu Long basin, where new techniques have been developed, tested and successfully applied for exploration, reservoir characterization, and well planning. The technique focuses on the simulation of fracture systems based on the understanding of the processes that are responsible for their generation. The data are usually derived from seismic interpretations, well data (FMII) and analogue field observations. 3D structural modelling supplies the understanding of the deformation history and identifies the dominant structural processes responsible for the fracturing. The data and the modelling results are subsequently integrated in the Fracture Generator where one can interactively simulate the growth, spacing and orientation of the various fracture systems. Finally, the 3D discrete fracture networks can be exported to other software for reservoir simulation, volume calculations etc.
|
uStrategy & geological contexttBasic workflowtCuu Long basinuField InformationuStructural modelling & fracture simulation
uStrategy & geological contexttBasic workflowtCuu Long basinuField InformationuStructural modelling & fracture simulation
uStrategy & geological contexttBasic workflowtCuu Long basinuField InformationuStructural modelling & fracture simulation
uStrategy & geological contexttBasic workflowtCuu Long basinuField InformationuStructural modelling & fracture simulation
uStrategy & geological contexttBasic workflowtCuu Long basinuField InformationuStructural modelling & fracture simulation
uStrategy & geological contexttBasic workflowtCuu Long basinuField InformationuStructural modelling & fracture simulation
uStrategy & geological contexttBasic workflowtCuu Long basinuField InformationuStructural modelling & fracture simulation
|
Strategy and Geological Context Basic Workflow · Seismic data forms the key constraints on the deformation intensity and history of a specific area (Fig. 1a1A). · Field analogue observations yield insight in the deformation style and mechanical behaviour of the rocks (Fig. 1a1B). · Well data give in situ constraints on lithology, fracture density, orientation and characterisation (vuggy, open, closed, recrystalised etc.) (Fig. 1a1C). · Structural modelling simulates the deformation history and yields quantitative estimates of the deformation (strain values) (Fig. 1a1D). · 3D discrete fracture networks are interactively modelled based on the data and the modelling results (Fig. 1a1E). The Cuu Long basin is situated in the SE offshore area of Vietnam (Fig. 1b1). Its tectonic history can be characterised by three distinct phases: 1: Jurassic-Cretaceous: magmatic intrusions of large granitoid bodies. 2: Late Cretaceous-Paleogene: extensional basin formation. 3: Neogene basin sediment infill and local inversion (Fig. 1b2). The crystalline basement is predominantly made up of dioritic.granitoid plutonic rocks and its volcanic equivalents. It has been successfully producing oil from the Bach Ho and Rang Dong fields, among others, where the fracture systems define the reservoir exploration and production potential. Primary ("Cooling") fractures Fieldwork onshore Vietnam outside the deformation front shows that all granitic basement has a typical joint set structure ascribed to the initial emplacement and crystallisation of the magma (Fig. 2a1, 2a2, 2a3). Fractures are regularly spaced and two sets of orthogonal orientations are dominant. Fractures are commonly filled with pegmatite and aplite confirming the early generation of these joint sets. The orientation and spacing of the joint sets is controlled by the crystal size (cooling rate) and geometry of the intrusive body as well as crystal orientation due to magmatic flow. In the case of subsurface prospects these factors are hard to constrain and cooling fractures have only been modelled in a stochastic way. Secondary ("Deformation") fractures Inside the extensional deformation front the rocks are predominantly characterised by conjugate shear fractures (and reactivated cooling fractures) (Fig 2b1). Deformation fractures are commonly longer and more densely spaced than cooling fractures but the spacing and orientation of the fractures varies greatly over short distances. Due to the (repeated) slip along the fractures they commonly develop brecciated damage zones. Subseismic faults develop where strain concentration has taken place (Fig. 2b2). These fault zones form potentially important corridors for fluid flow. Radiometric dating of intruded dykes shows the secondary fractures that formed during the main phase of extensional basin formation (Paleogene). Fracturing is the dominant mechanism that accommodates deformation. Therefore, the spatial distribution of deformation is the controlling factor for the variation in spacing and orientation of the secondary fractures. As such, the deformation visible on the seismic interpretation (Fig. 2b3) forms the main constraint for fracture appraisal. Restoration of the interpretation with 3D structural modelling software yields quantitative 3D strain estimates that are used to control simulated fracture growth in the Fracture Generator. Structural Modelling and Fracture Simulation Procedure Step 1: Present-day model (Fig. 3a) is restored (Fig. 3b), using kinematic algorithms along the hanging wall. The results represent the geological situation before deformation took place. At this stage the cooling fracture growth is simulated using constant spacing and orientation. Step 2: The restored model (Fig. 3b) is forward modeled to simulate part of the deformation history (Fig. 3c). The cooling fractures are accordingly deformed. Strain estimates are calculated during the simulation. Step 3: The surface is colour-coded for dilational strain (Fig. 3d). Shear-fracture growth is simulated using the strain parameters to control the spacing and orientation of the fractures. The 3D resulting fracture network (Fig. 3d, 3e) can be compared to well information (diagrams in Fig. 3e) and field analogues (Fig. 3f) for validation and exported to flow simulators like Eclipse, Mafic, etc. Any deformation process can potentially be modelled and analysed in 3DMove. Two examples are shown in Fig. 4a (the fault damage zone) and in Fig. 4b (footwall uplift). The modelling results can be used to represent the fracture systems according to the appropriate geological processes. With the presented techniques, it is possible to recognise complex fracture systems due to various interacting deformation processes operating at the same time (Fig. 4c). The fracture systems can be exported to other software for reservoir simulations and further analysis. As importantly, the tools allow the user to form an understanding of the geological processes responsible for the generation of the complex fracture patterns often observed in naturally fractured rocks. With that knowledge predictions can be made for the fracture systems in areas with no fracture data. This is crucial information for planning successful exploration and production strategies in all reservoirs where natural fracturing plays a role. Cloos, Hans, 1922, Uber Ausbau und Anwendung der granit-tektonischen Methode: Preuss. Geol. Landesanst., Abh., v. 89, p. 1-18. We wish to thank BP, JVPC, CLJOC, VPI, HLJOC and Schlumberger for cooperation during the development of the presented techniques. |
 Fig.
1a. Illustrations of types of data: seismic (1A), field analogue (1B), well data
(1C).
Fig.
1a. Illustrations of types of data: seismic (1A), field analogue (1B), well data
(1C). Fig.
1b. Index map of Vietnam, with general area inclusive of Cuu Long basin (Fig.
1b1), and cross-section of the basin (Fig. 1b2).
Fig.
1b. Index map of Vietnam, with general area inclusive of Cuu Long basin (Fig.
1b1), and cross-section of the basin (Fig. 1b2). Fig.
2a1. Evenly spaced vertical cooling fractures in granite, Vietnam.
Fig.
2a1. Evenly spaced vertical cooling fractures in granite, Vietnam. Fig.
2a2. Same outcrop as Fig. 2a1 viewed from the top. Fractures are filled with
pegmatite. Note the orthogonal joint set relations.
Fig.
2a2. Same outcrop as Fig. 2a1 viewed from the top. Fractures are filled with
pegmatite. Note the orthogonal joint set relations. Fig.
2b1. Conjugate shear fractures in granite, Vietnam. The spacing of the fractures
typically varies strongly over 100m distance.
Fig.
2b1. Conjugate shear fractures in granite, Vietnam. The spacing of the fractures
typically varies strongly over 100m distance. Fig.
2b2. Subseismic fault consisting of 2-m-wide brecciated corridor in granite.
Fig.
2b2. Subseismic fault consisting of 2-m-wide brecciated corridor in granite. Fig.
2b3. Main fault and subseismic fractures in hanging wall block.
Fig.
2b3. Main fault and subseismic fractures in hanging wall block. Fig.
3a. Original model colour mapped for depth.
Fig.
3a. Original model colour mapped for depth. Fig.
3b. Model kinematically restored.
Fig.
3b. Model kinematically restored. Fig.
3c. Model kinematically forward modeled.
Fig.
3c. Model kinematically forward modeled.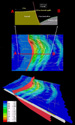 Fig.
4b. An example of strain calculation to flexural footwall uplift (in section and
maps) compared to hanging wall deformation. Strain in the footwall is an order
of magnitude lower than in the hanging block, and no shear fractures are likely
to form in the footwall.
Fig.
4b. An example of strain calculation to flexural footwall uplift (in section and
maps) compared to hanging wall deformation. Strain in the footwall is an order
of magnitude lower than in the hanging block, and no shear fractures are likely
to form in the footwall.