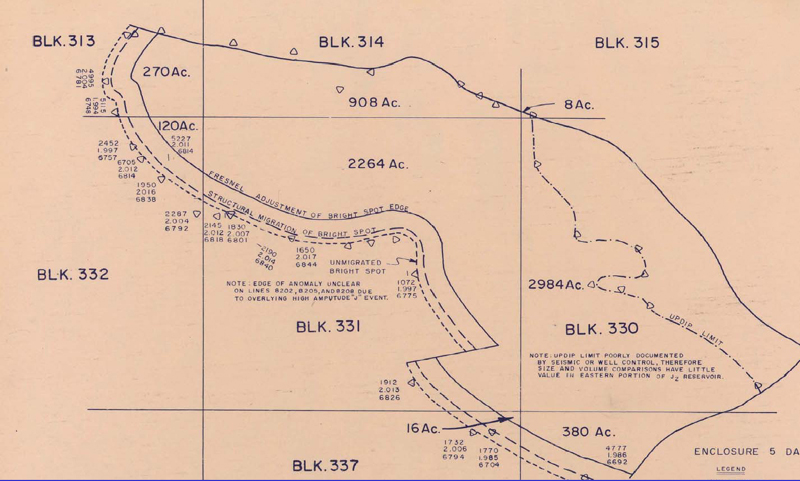
Figure 10. Map of “J” sand “Bright Spot” outline, which conforms to structural closure, as shown in Figure 7. Outline is based on unmigrated seismic data; the Fresnel Zone correction and outline after structural migration are also shown.
Figure 10. Map of “J” sand “Bright Spot” outline, which conforms to structural closure, as shown in Figure 7. Outline is based on unmigrated seismic data; the Fresnel Zone correction and outline after structural migration are also shown.