PSIntegrated Analysis
of the ![]() Bakken
Bakken![]()
![]() Petroleum
Petroleum![]()
![]() System
System![]() , U.S. Williston Basin
, U.S. Williston Basin
By
Jack Flannery1 and Jeff Kraus2
Search and Discovery Article #10105 (2006)
Posted May 23, 2006
*Poster presentation, at AAPG Annual Convention, Houston, Texas, April 10-12, 2006 (with adaptation for HTML version)
Click to view posters in PDF format.
Poster 1 (3.6 mb) Poster (4.3 mb) Poster (3.4 mb)
1Tethys Geoscience, Denver Colorado
2Formerly Tethys Geoscience, Denver Colorado, currently ExxonMobil, Houston Texas ([email protected])
As much as 300 billion barrels of oil have been
generated from Upper Devonian-Lower Mississippian ![]() Bakken
Bakken![]() shales in the U.S.
Williston Basin. Recent industry activity has been focused on the middle
shales in the U.S.
Williston Basin. Recent industry activity has been focused on the middle ![]() Bakken
Bakken![]() siltstone trend in Richland County, Montana. Operators there are enjoying
impressive success rates from wells that test 500 barrels of oil per day, on
average. Horizontal drilling, completion, and fracturing technology are
generally credited with opening up the historically disappointing play.
Companies are now extending the play in to other parts of the Basin. Future
success will rely largely upon developing a thorough understanding of the play
as it is currently being exploited and, especially, upon using that
understanding to identify key geologic controls of
siltstone trend in Richland County, Montana. Operators there are enjoying
impressive success rates from wells that test 500 barrels of oil per day, on
average. Horizontal drilling, completion, and fracturing technology are
generally credited with opening up the historically disappointing play.
Companies are now extending the play in to other parts of the Basin. Future
success will rely largely upon developing a thorough understanding of the play
as it is currently being exploited and, especially, upon using that
understanding to identify key geologic controls of ![]() Bakken
Bakken![]() prospectivity that can
be capitalized on elsewhere.
prospectivity that can
be capitalized on elsewhere.
Regional structure
and isopach maps, along with geochemical, thermal, and rock properties data, are
used to construct a three-dimensional thermal and fluid flow model of the basin.
The model provides unique insight into the evolution of the ![]() Bakken
Bakken![]()
![]() petroleum
petroleum![]()
![]() system
system![]() and allows us to predict reservoir quality, source maturation, and
volumes of oil expelled and currently trapped within the middle
and allows us to predict reservoir quality, source maturation, and
volumes of oil expelled and currently trapped within the middle ![]() Bakken
Bakken![]() .
Integration and spatial analysis of modeled results, regional maps, and measured
data shed light upon the fundamental geologic variables and relationships that
control
.
Integration and spatial analysis of modeled results, regional maps, and measured
data shed light upon the fundamental geologic variables and relationships that
control ![]() Bakken
Bakken![]() prospectivity. Key factors include maximum reservoir temperature,
stratigraphic architecture, and small-scale porosity development. We interpret
potential for additional middle
prospectivity. Key factors include maximum reservoir temperature,
stratigraphic architecture, and small-scale porosity development. We interpret
potential for additional middle ![]() Bakken
Bakken![]() exploration downdip from the current
siltstone play where the middle
exploration downdip from the current
siltstone play where the middle ![]() Bakken
Bakken![]() thickens and becomes sandier.
thickens and becomes sandier.
|
|
The
The
The middle
The
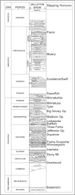
Figure 1-16 shows, on an annual basis, production from the 1) Trapping Mechanism
2) Maximum Temperature
AcknowledgmentsData Sources: Technology: IHS Energy ESRI ArcGIS NDGS IES PetroMod3D USGS Spotfire DecisionSite Humble Geochem. Serv.
|


|
|
|
|
|
|
|
|
Figure 2-3. Maximum Click to view thermal parameters in sequence (Figures 2-1 to 2-3). |


Geochemical Calibration
|
|
Figure 2-4. Measured |
|
|
|
|
|
Figure 2-6. Measured
|
|
|
Figure 2-7. Measured |
|
|
Figure 2-8. Oil families--has color (Humble Geochemical Services).
|
 |
Figure 2-9. Distribution of
Click to view geochemical parameters in sequence (Figures 2-4 to 2-9). |


Modeling Results


The basin model was calibrated with more than 12,000 corrected bottom hole temperature (BHT) measurements provided by the North Dakota Geologic Survey (NDGS) and the North America heat flow database, from Southern Methodist University (Figures 2-1 and 2-2). A relatively good correlation between regional heat flow and geothermal gradient provided additional support and was used as input to the 3D thermal modeling. A local thermal anomaly exists in the southwestern portion of North Dakota. Previous workers comment on a thermal anomaly along the Nesson Anticline, but this anomaly is not apparent in the complete database (Figures 2-1, 2-2, and 2-3).
Thermal calibration was also substantiated byTmax data (Figure 2-4) from the upper and lower shale units. We had no vitrinite reflectance (only modeled reflectance [Figure 2-5]) or other paleothermometers to further calibrate the model.
The middle ![]() Bakken
Bakken![]() reached its maximum
temperature in the Early Tertiary and has since cooled 20-30C.
reached its maximum
temperature in the Early Tertiary and has since cooled 20-30C.
Both the upper and lower shale units are very organic-rich across much of the basin (Figure 2-6). Measured hydrogen index decreases as maturity increases towards the basin center (Figure 2-7).
![]() Bakken
Bakken![]() -sourced oils (Figures
2-8 and 2-9) are
generally found where the
-sourced oils (Figures
2-8 and 2-9) are
generally found where the ![]() Bakken
Bakken![]() is mature, except in the Poplar Dome
area where faulting has provided cross-formational migration pathways
and in the northern part of the U.S. Williston Basin, where
is mature, except in the Poplar Dome
area where faulting has provided cross-formational migration pathways
and in the northern part of the U.S. Williston Basin, where ![]() Bakken
Bakken![]() oil
is migrating northward.
oil
is migrating northward.
The greatest volume of oil generated from the
![]() Bakken
Bakken![]() was in the northwest of the basin center (Figure
2-10), where both the upper
and lower
was in the northwest of the basin center (Figure
2-10), where both the upper
and lower ![]() Bakken
Bakken![]() shale members are thickest and mature. The map of the
relative volume of oil generated has been regridded and is unit-less
(Figure 2-11).
shale members are thickest and mature. The map of the
relative volume of oil generated has been regridded and is unit-less
(Figure 2-11).
Analysis - Building the Play Elements
Spotfire DecisionSite Analysis
|
|
|
|
|
|
|
|
|
|
|
|
|
|
|
 |


Critical Element Analysis
Figure 3-1 demonstrates that oil test flow rate is depth dependent. Most
successful ![]() Bakken
Bakken![]() wells have been drilled between 9,300 feet and 11,500
feet. The upper (shallow) limit is governed by thermal maturity and
correlates with the depth at which significant oil expulsion begins.
wells have been drilled between 9,300 feet and 11,500
feet. The upper (shallow) limit is governed by thermal maturity and
correlates with the depth at which significant oil expulsion begins.
Figure 3-2 shows a gradual increase in gas flow rate, which abruptly declines below 11,500 feet. This may signify a decline in reservoir quality with depth. However, more drilling is required to sufficiently determine whether a depth control over reservoir quality exists.
Figure 3-3 suggests a gradual increase in Gas:Oil Ratio (GOR) with
depth, but the trend is poorly defined. Because GOR does not correlate
well with depth or maturity, and the ![]() Bakken
Bakken![]() is a high-quality oil-prone
source rock, possibly reservoir quality (RQ) or completion practices are
the fundamental controls.
is a high-quality oil-prone
source rock, possibly reservoir quality (RQ) or completion practices are
the fundamental controls.
Figure 3-4 shows that tests with low oil flow rates tend to have higher
gas flow rates. Because the ![]() Bakken
Bakken![]() is not overmature for oil generation
anywhere in the basin, this relationship reinforces the idea that RQ and
well completion practices govern gas production and GOR. Vertical
is not overmature for oil generation
anywhere in the basin, this relationship reinforces the idea that RQ and
well completion practices govern gas production and GOR. Vertical ![]() Bakken
Bakken![]() tests have higher GOR than do horizontal. Recent
tests have higher GOR than do horizontal. Recent ![]() Bakken
Bakken![]() completions in
Richland Co., MT have lower GOR.
completions in
Richland Co., MT have lower GOR.
Figure 3-5 illustrates the depth-dependant relationship between oil
expulsion and depth. Thickness and maturity control oil expulsion in the
![]() Bakken
Bakken![]() .
.
Figure 3-6 shows that local charge does not appear to govern oil test
rates. However, in areas where the ![]() Bakken
Bakken![]() is immature, oil tests are
low.
is immature, oil tests are
low.
Play Fairway Interpretation
|
|
Figure 3-7. Middle |
|
|
Figure 3-8. Middle |
|
|
Figure 3-9. Average middle |
|
|
Figure 3-10. Middle
Click to view middle |
|
|
Figure 3-11. Lower |
 |
Figure 3-12. Middle |


The first oil saturation map (Figure 3-7) is the result from PetroMod’s
default compaction model. The second oil saturation map (Figure
3-8) is
derived from the calibrated porosity-depth curve, and illustrates the
result of 300 BBO with too little pore space to occupy. The actual
distribution of oil saturation probably lies somewhere between these two
results. We attempted to predict the occurrence of fracturing caused by
overpressure during peak oil generation (>120C). We also modified
default compaction parameters of the middle ![]() Bakken
Bakken![]() siltstones to match
published core porosity data (Figure 3-9).
siltstones to match
published core porosity data (Figure 3-9).
Depth of burial, estimated reservoir quality (Figure
3-10) and modeled
oil saturation (along with lower ![]() Bakken
Bakken![]() data [Figure
3-11) are used to
construct a map of middle
data [Figure
3-11) are used to
construct a map of middle ![]() Bakken
Bakken![]() play areas. The spots on the map are
middle
play areas. The spots on the map are
middle ![]() Bakken
Bakken![]() wells completed since January 1, 2005, when we completed
our interpretation of the play fairways (Figure 3-12).
wells completed since January 1, 2005, when we completed
our interpretation of the play fairways (Figure 3-12).
Conclusions
1) Maximum temperature, which was reached in the early Tertiary, is the governing factor over:
-
Oil generation
-
Fracture development
-
Primary reservoir quality.
2) The effectiveness of the stratigraphic trap along the southwestern basin margin is primarily responsible for:
-
>90% oil saturation
-
High drilling success rates.
3) These conditions also exist:
-
Downdip, toward the basin center
-
Along strike to the southeast.
4) Additional middle ![]() Bakken
Bakken![]() reservoirs exist in North Dakota; this
relationship may expand the play if:
reservoirs exist in North Dakota; this
relationship may expand the play if:
-
Structural traps can be identified
-
Fracture porosity is developed.
5) ![]() Bakken
Bakken![]() shales may prove productive with modern drilling and completion.
shales may prove productive with modern drilling and completion.